Z604/Z672 Comic Books and Their Readers, Spring 2023
Digital and Empirical Methods for Studying Readership and Fandom.
View the Project on GitHub jawalsh/z604-z672-comic-books-and-their-readers
Week 9: Data visualization lab
Summary
This week we will gain hands-on experience with some data visualization tools and create visualizations from comics-related data sets.
Weekly Learning Objectives
- create data visualizations in Excel.
- create data visualizations in Tableau.
- create data visualizations in Flourish.
Before class: Readings, resources, and tasks
- Install Microsoft Excel (see https://iuware.iu.edu/).
- Create a Flourish account.
-
Create a Tableau account.
- Information Visualization Discussion and Evaluation
In class
Counting genres
Dataset
Tool: Microsoft Excel
- Open Excel file.
- Create a new sheet and name the new sheet
Counting. - Get genres from the
Cooper Collections Storiessheet- Excel option
- copy and paste
GENRE - STORYcolumn fromCooper Collections Storiessheet toCountingsheet - Select
GENRE - STORYcolumn inCountingsheet and runRemove Duplicatesfunction.
- copy and paste
- Atom option
- select and copy the
GENRE - STORYcolumn - paste into a text editor (e.g., Atom)
- Select All with
Cmd-A(MacOS) orCtrl-A(Windows) - Install
sort-linespackage in atom- From within Atom:
Settings -> Install-> search for “sort-lines” and click “Install” - Type
Cmd-Shift-P(MacOS) orCtrl-Shift-P(Windows); then typesort; then select theSort Lines: Uniquecommand.
- From within Atom:
- select and copy the
- Excel option
- In new sheet create a column “genres” with one row for each genre:
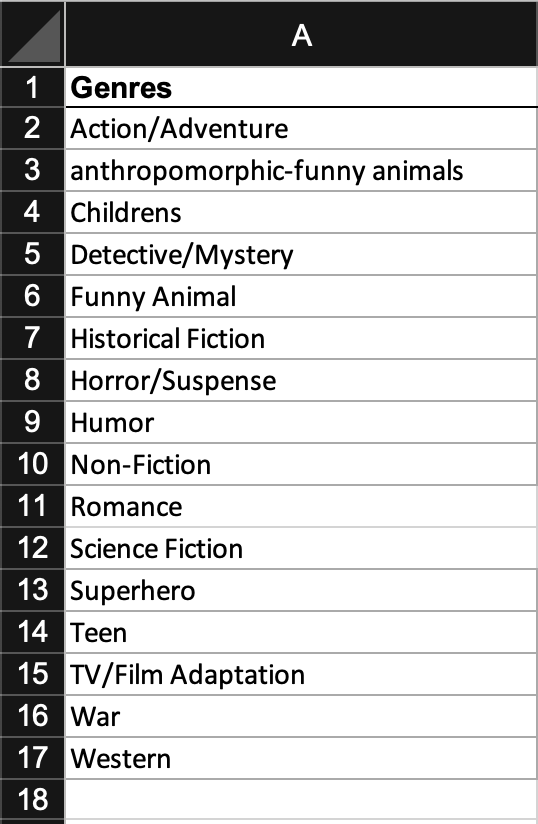
Fig. 1. Genre column. - Count the genres
- In
Countingsheet, next to thegenrescolumn, create acountcolumn - In the first cell of the
countcolumn, enter the formula=COUNTIF('Cooper Collection Stories'!M:M,Counting!A2) - copy and paste this formula in the other rows
- In
- Add percentages
- In
Countingsheet, next to thecountcolumn, create apercentagecolumn - In the first cell of the
percentagecolumn, enter the formula=B2/SUM($B$2:$B$17) - copy and paste this formula in the other rows
- select the row and change the format to
Percentage
- In
- Insert chart from the
Inserttoolbar.
Mapping Publishers
Dataset
- Michigan State University comics-as-data.
Tool: Flourish.
- Login to your Flourish account.
- Select
New Visualization - Under
Projection map, select theUS (states)option. - Select the
Datatab. - Select the
Pointstab. - Select
Upload datato upload thecomics_as_data_north_america_2020-01-20_reconciled_full.csvfile. - Enter the appropriate columns for
Name,Longitude, andLatitude. - Preview your visualization.